Chasing 12:03 — 25 Years Later
Way back in high school, my PE teacher had a simple grading rule for the running unit: run two miles in under twelve minutes to earn an A. I crossed the line in 12:03, just three seconds too slow, finishing with three classmates ahead of me and a big gap to the rest of the pack. The teacher grouped the four of us together as the “A group,” and I remember feeling both lucky and completely exhausted.
Now, more than twenty-five years later, I’ve set myself a new goal: to train, prepare, and finally beat that 12:03 mark. This time, it’s not for a grade, but rather it’s for the challenge, the process, and the satisfaction of seeing how much smarter and stronger training can be the second time around.
I recently completed a hilly 10 km race in 44:43 (4:28 min/km) and have an upcoming 8 km event that I ran last year in 34:25 (4:18 min/km). Using a simple linear estimate, if I can run 5–10 seconds per kilometre faster for every 2 km drop in distance, then my targets would be roughly 4:10 min/km for 6 km and 4:05 min/km for 4 km.
Rather than chasing pace alone, my training focuses on improving my lactate threshold, the effort level where speed and endurance meet. By raising the pace I can sustain just below and slightly above this threshold, I believe that is my best training option for turning that old 12:03 benchmark into something I can finally beat.
6-Week LT2 Development Plan
Objective: Raise LT2 pace (~4:20 /km) toward 4:05 /km to support a 3.2 KM (less than 12 min) goal by January 7 2026.
Structure: Two quality sessions per week (Sunday & Thursday).
Emphasis: Aerobic efficiency, threshold durability, and recovery balance.
Target Zones
| Zone | HR Range (BPM) | Pace Range (min / km) | Description |
|---|---|---|---|
| Easy / Endurance | ≤ 121 | 5:30 – 6:00 | Aerobic base, recovery, capillarization. |
| Over–Under (Below) | 139 – 144 | 4:40 – 4:30 | Controlled aerobic effort near LT2. |
| Over–Under (Above) | 147 – 155 | 4:20 – 4:10 | Mildly above LT2; improves lactate clearance. |
| Threshold (LT2) | 146 – 152 | 4:20 – 4:05 | Core development zone for raising LT2 pace. |
| VO₂ Intervals (250 m) | > 155 | 3:35 – 3:25 | Speed maintenance, neuromuscular turnover. |
Weekly Layout (Monday – Sunday)
| Day | Session | Purpose |
|---|---|---|
| Monday | Rest | Full recovery; consolidate adaptations. |
| Tuesday | Endurance Run (LT1 below) 6–8 KM | Maintain aerobic base with low fatigue. |
| Wednesday | Mobility + Strength (30 min) | Core stability, single-leg control, hip strength. |
| Thursday | Threshold Intervals (LT2 above) — start 3 × 2 KM (2 min jog recoveries); progress to 3 × 2.5 KM by Week 6. | Primary LT2 stimulus; accumulate 25–35 min near threshold. |
| Friday | Recovery Jog (LT1 below) 5 KM walk if needed | Promote blood flow and recovery. |
| Saturday | Endurance Progression (LT1 below) 7–9 KM; finish last 2 KM steady (below LT2) | Extend aerobic capacity; steady pacing under mild fatigue. |
| Sunday | Over–Under Run 7–8 KM — alternate 5 min (LT2 below) / 2 min (LT2 above) | Controlled lactate exposure; bridges aerobic and threshold systems. |
6-Week Progression Focus
| Phase | Weeks | Focus | LT2 Time Target |
|---|---|---|---|
| 1 – 2 | Base Control | Learn HR discipline; manage drift | 20–25 min @ LT2 |
| 3 – 4 | Threshold Expansion | Extend duration; reinforce pace control | 25–30 min @ LT2 |
| 5 – 6 | Tolerance + Sharpening | Final reps touch LT2 above for 2–3 min | 30–36 min @ LT2 |
Notes
- Sunday & Thursday: Key quality days — manage recovery between.
- Tuesday & Saturday: Supportive aerobic days, stay relaxed.
- Optional VO₂ tune-up: Every 3rd week replace Thursday session with 8 × 250 m (LT2 above → VO₂) 90 s rest.
- Monitor HR trends: If resting HR ↑ > 5 BPM for 2 days, skip next hard session.
- Re-test LT2 pace late December; adjust zones before sharpening phase.
Week 2: Saturday, November 8
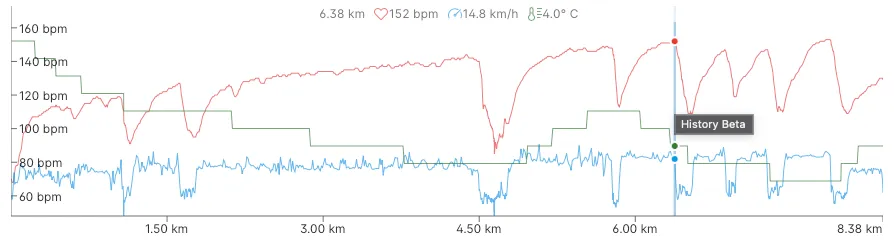
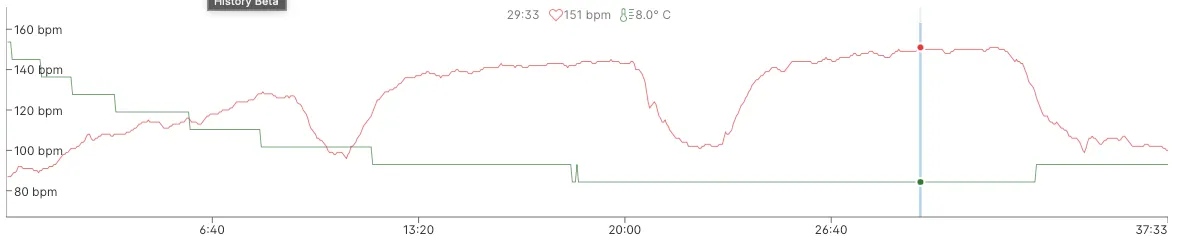
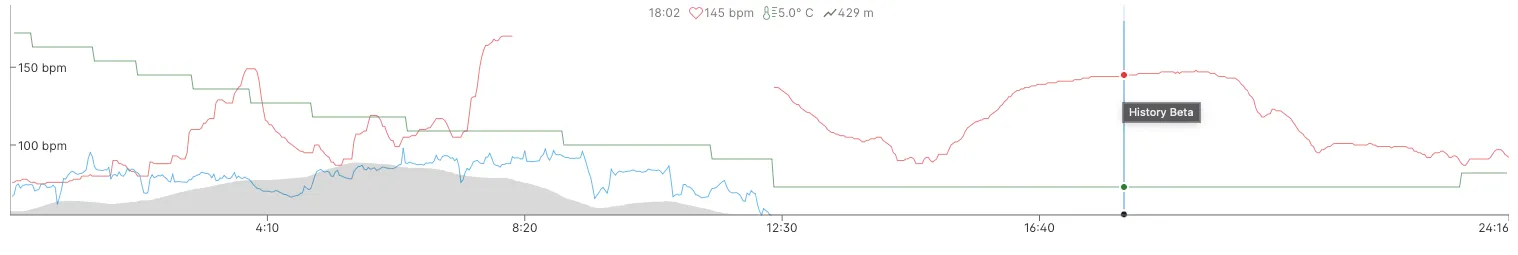
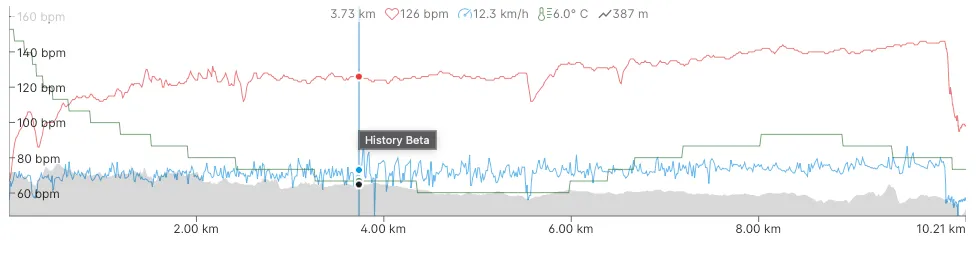
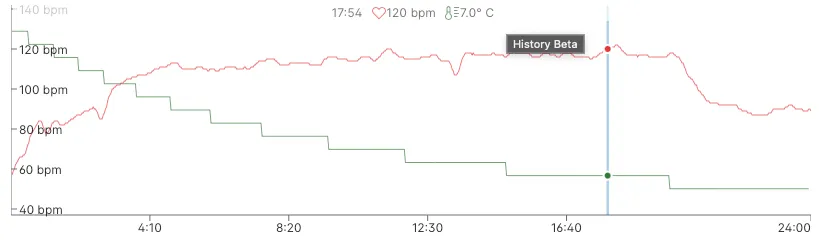
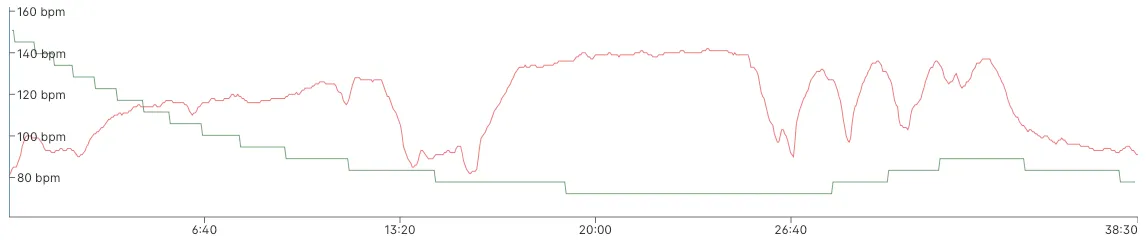
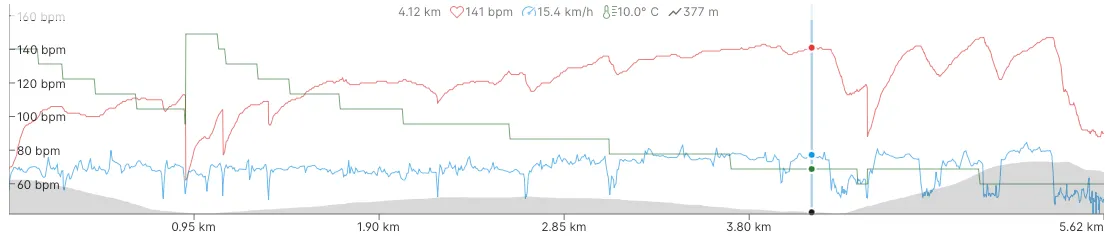
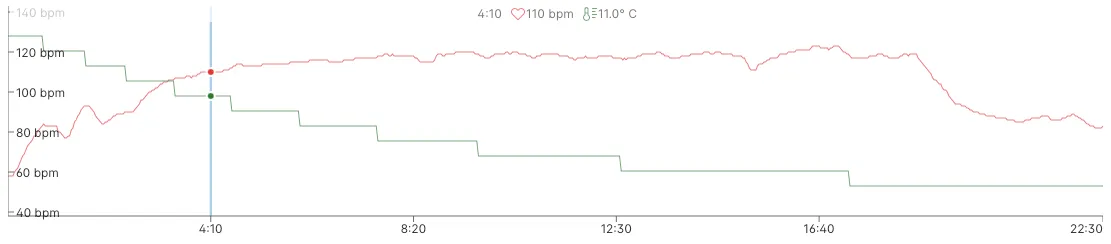
Today’s training objective was to complete a 7-9 KM run below LT1 under mild fatigue and that is exactly how the training went. 7 km distance, heart rate ≤ 121 BPM with an average pace of 10.8 km/h. The dips in heart rate are due to waiting at traffic lights. Notice how gradual the heart rate increases once I start running again.
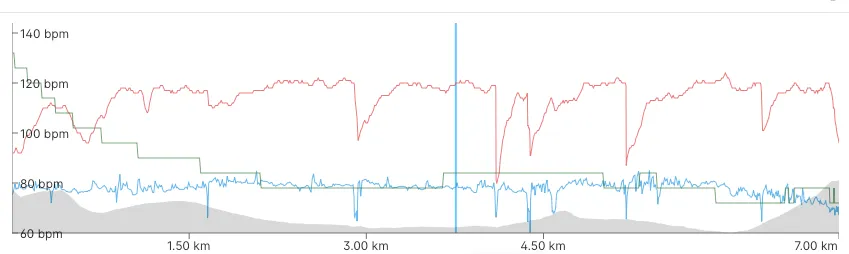 Red line -> Heart Rate, Blue line -> Pace, Green Line -> Ambient Temperature, Grey Area -> Elevation.
Normally when I get close to 120 BPM I have to slow the pace a lot to bring the heart rate down, however today, I just had to slow the pace slightly to bring down heart rate. I attribute this improved control to proper execution of last Thursday’s LT2 effort, which had just the right amount of stress to encourage adaptation.
I skipped increasing the pace over the last 2 km because the LT1 effort felt like enough stress. Looking forward to tomorrow’s over-under effort!
Week 2: Sunday, November 9
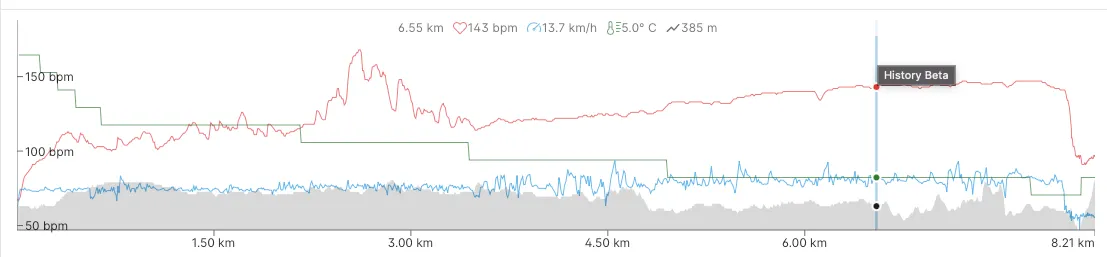
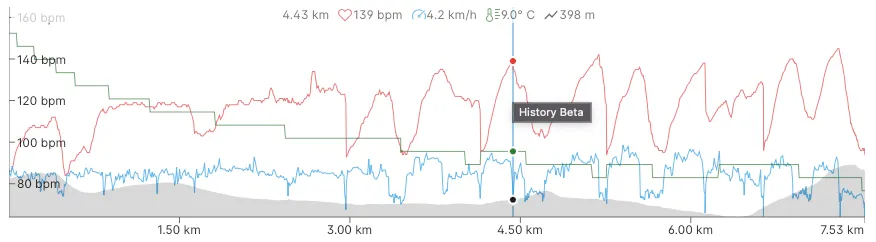
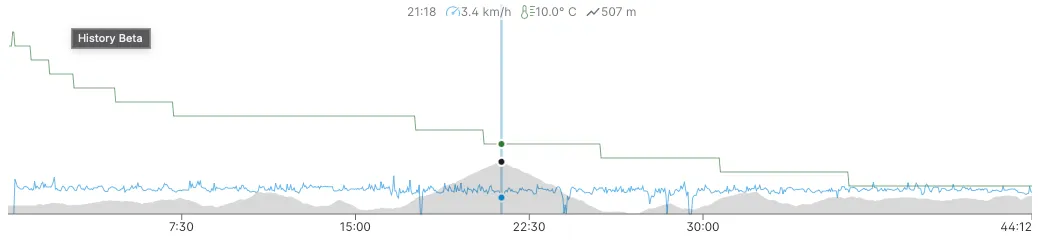
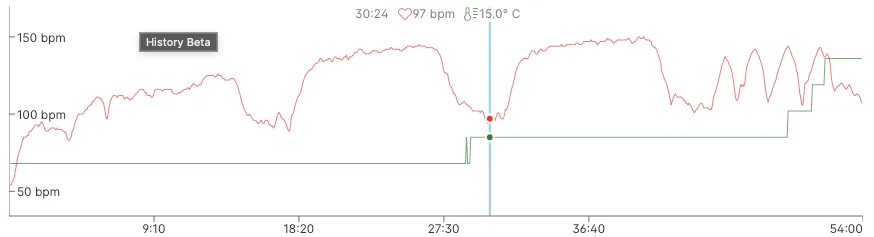
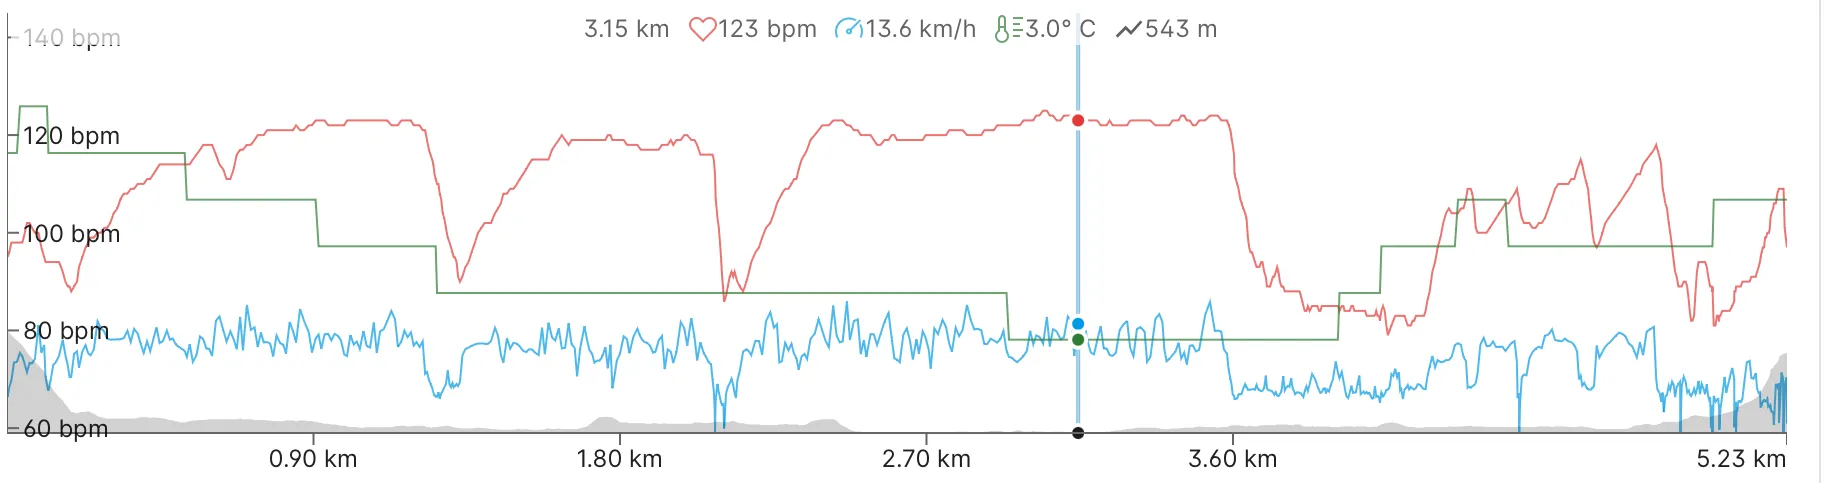
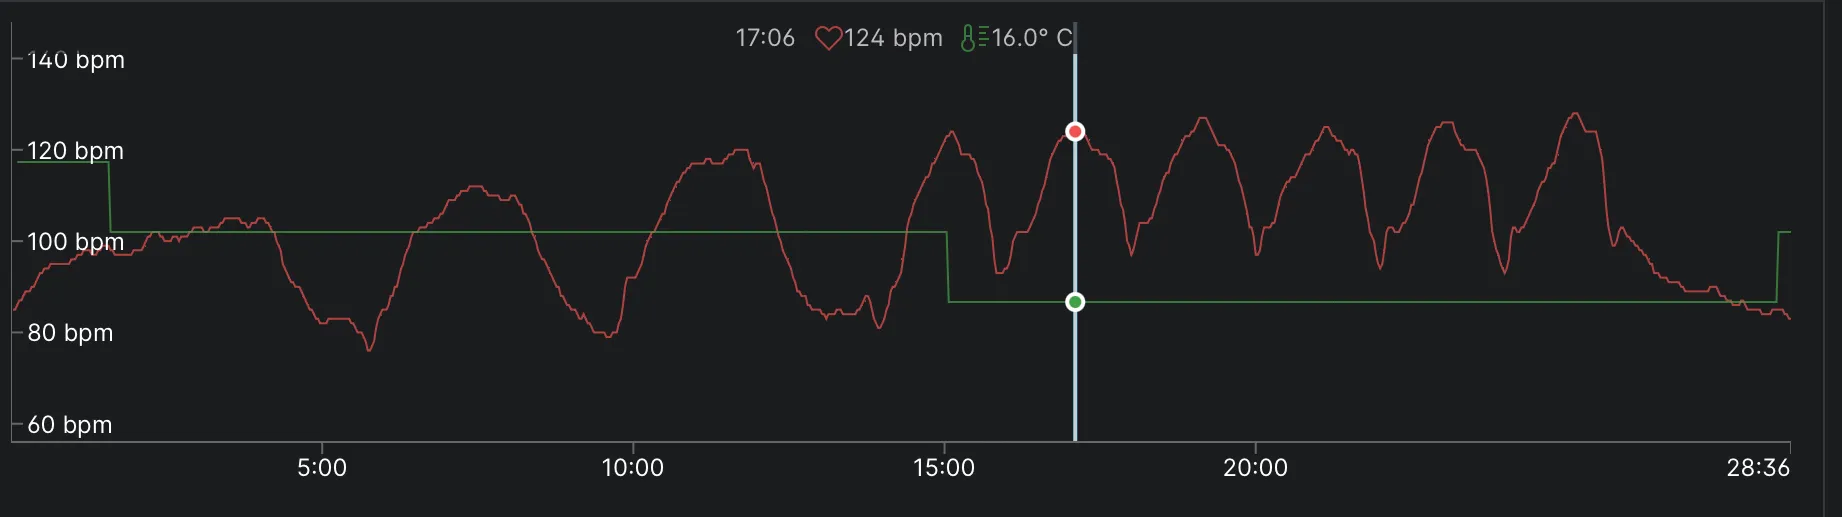
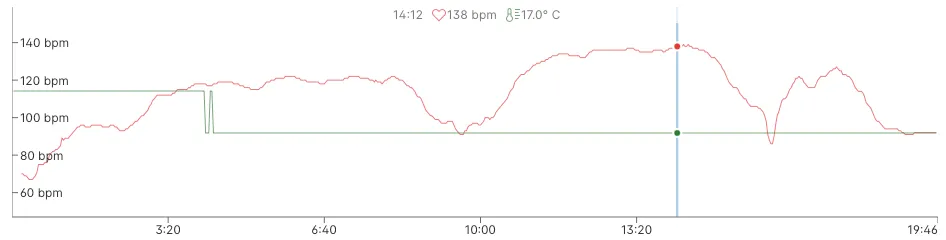
Today’s over-under run went well. Easy warm-up for 3 km then build pace until target heart rate reached and then hold for 5 minutes then increase for 2 minutes over, repeated for 30 minutes. The focus was heart rate range keeping the under between 140-144 BPM and the overs between 146-154 BPM. The pace felt great during the 2-minutes over. As I moved back to the under range the breathing was very deep for several minutes; getting more comfortable tolerating the deep breathing.
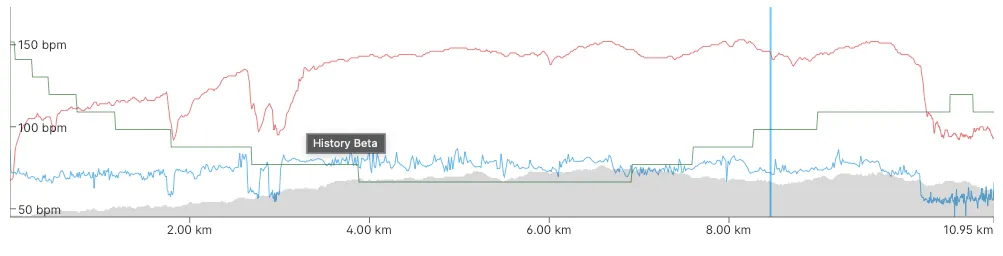 Red line -> Heart Rate, Blue line -> Pace, Green Line -> Ambient Temperature, Grey Area -> Elevation.
Week 2: Summary
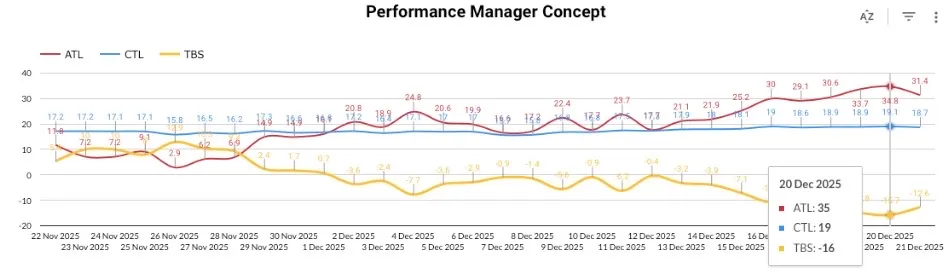
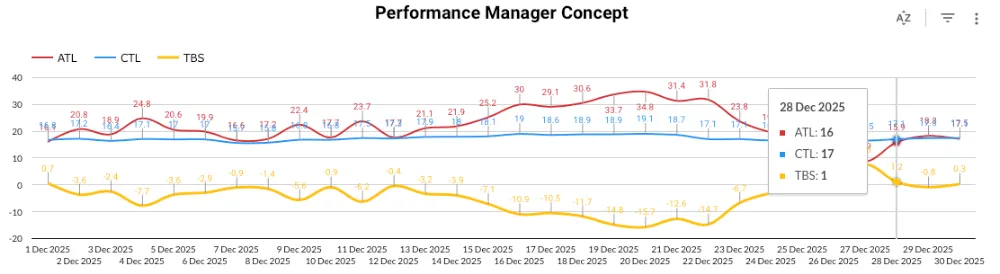
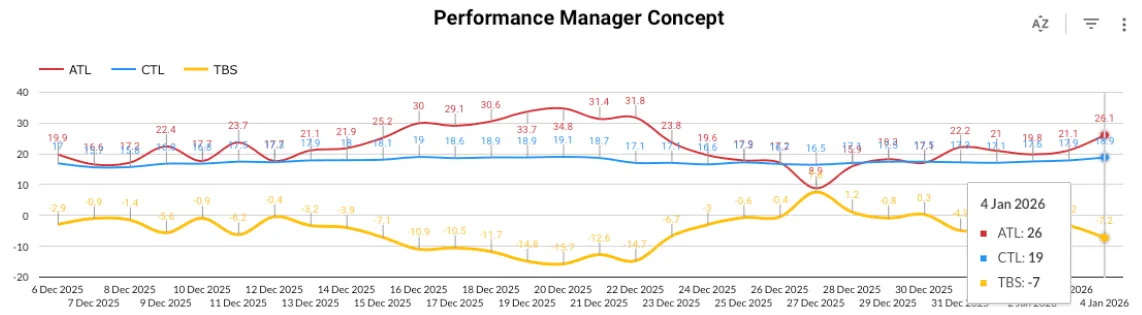
The Acute Training Load (ATL) has increased too quickly relative to the Chronic Training Load (CTL). I need to take a more measured approach during week 3 to avoid overtraining or sickness.
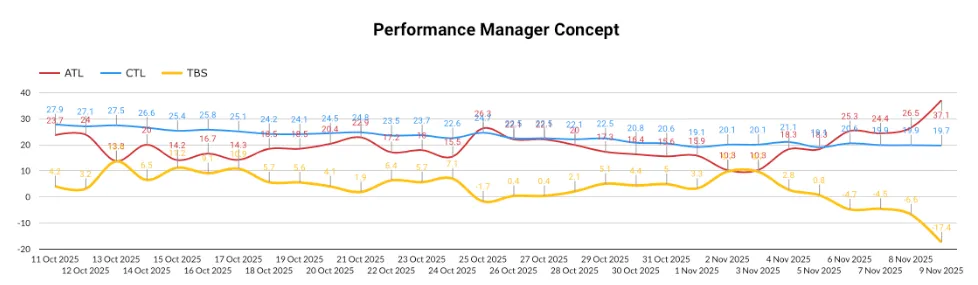
I’ll reduce intensity and time in week 3 in an effort to keep ATL and CTL value within 10 units of each other.
Week 3: Tuesday, November 11
Training goal achieved. Now time to reflect and thank those that gave for us.
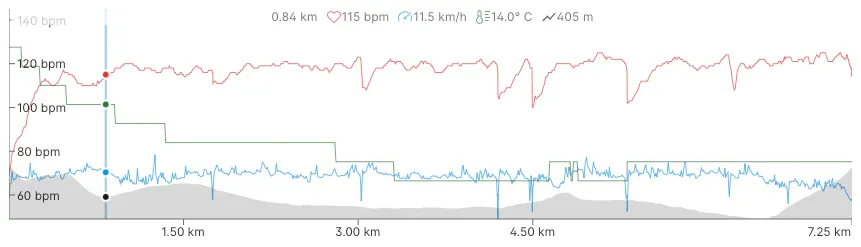 Red line -> Heart Rate, Blue line -> Pace, Green Line -> Ambient Temperature, Grey Area -> Elevation.
Week 3: Thursday, November 13
Training objective was Threshold Intervals (LT2 above), but just couldn’t execute. Poor sleep and diet impacted the work.
 Red line -> Heart Rate, Blue line -> Pace, Green Line -> Ambient Temperature, Grey Area -> Elevation.
Have to refocus and spend more time on core stability in order to handle the over LT2 pace.
Week 3: Friday, November 14
Nice easy walk in the fall air. Will do some core work also.
 Red line -> Heart Rate, Blue line -> Pace, Green Line -> Ambient Temperature, Grey Area -> Elevation.
Week 4: November 17 to 23
Rest week. Light training focused on recovering from training load.
Week 5: Tuesday, November 25
Ease back into training with a 4 KM run at LT1. Breathing felt easy, nice to be running again.
 Red line -> Heart Rate, Blue line -> Pace, Green Line -> Ambient Temperature, Grey Area -> Elevation.
Week 5: Thursday, November 27
About 5.5KM on the treadmill. Began with about 3 KM at LT1. Did 3x400m efforts at 8.1 MPH near the end to add some TSS.
 Red line -> Heart Rate, Blue line -> Pace, Green Line -> Ambient Temperature, Grey Area -> Elevation.
Week 5: Friday, November 28
A little busy today. Instead of a run, did full-body resistance training followed by stretching.
An aside: I’ve been aware of tight hip flexor on my left side for years. I am slowly correcting this imbalance through PNF1-type stretching. I recently started following these exercises from Precision Movement. If you have a similar issue or just interested in learning more, check out this video: How to Fix Hip Flexors.
Week 5: Saturday, November 29
Plan is to increase the TSS and back to increasing CTL. Goal achieved. A bit of unstructured speed work at the end of the session, but overall good to turn the legs over and get the heart rate above LT2 for a bit. In addition, yesterday’s hip flexor stretching was noticeable today as the left leg provided better push off the ground.
TSS: 55, CTL: 17, ATL: 15
 Red line -> Heart Rate, Blue line -> Pace, Green Line -> Ambient Temperature, Grey Area -> Elevation.
Week 6: Monday, December 1
Getting back into the training. Full LT1 treadmill session.
TSS: 8.33, CTL: 17, ATL: 16
 Red line -> Heart Rate, Blue line -> Pace, Green Line -> Ambient Temperature, Grey Area -> Elevation.
Week 6: Tuesday, December 2
Treadmill session, warm-up followed by 2 x 2 km sub-LT2. Breathing lightly considering closeness to LT2 threshold.
TSS: 33.21, CTL: 17, ATL: 21
 Red line -> Heart Rate, Blue line -> Pace, Green Line -> Ambient Temperature, Grey Area -> Elevation.
Week 6: Thursday, December 4
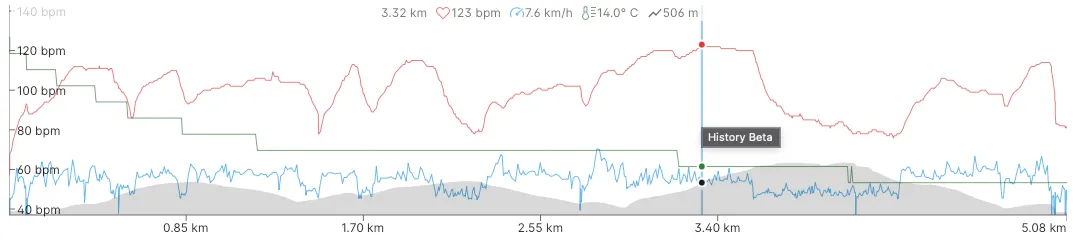
Warm enough for an outside run. Started slow and let the pace slowly build. Ran completely free. Near the end of the run, I intentionally slowed in an effort to keep below LT2. However, reviewing the numbers after the run, dipped above LT2. Can feel the effort now, hopefully, the correct amount of stimulus.
Note: Ignore the heart rate spike around 3 km, false reading.
TSS: 41.88, CTL: 17, ATL: 25
Red line -> Heart Rate, Blue line -> Pace, Green Line -> Ambient Temperature, Grey Area -> Elevation.
Week 6: Sunday, December 7
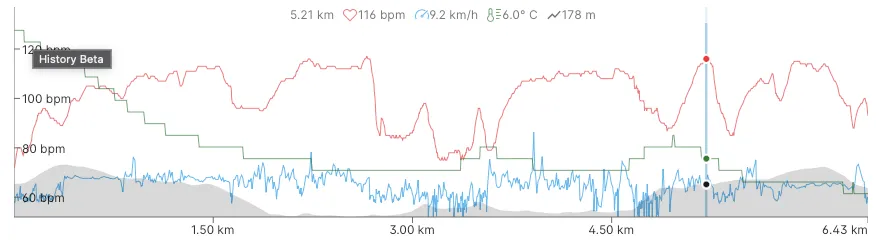
Mixed up the running, ran most of the way home from the next town. Very enjoyable view and +2 degrees Celsius. The effort was a slow increase in effort of the 11+ km. Maximum heart rate was 131 BPM, well under LT2.
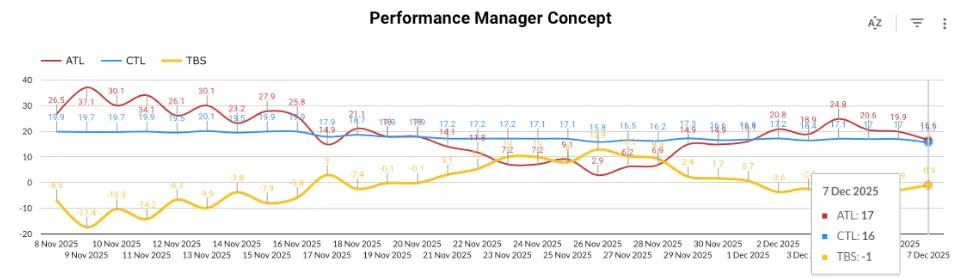
TSS: 32.67, CTL: 16, ATL: 17
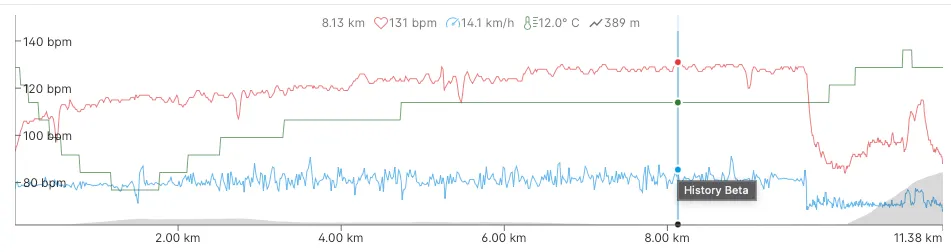 Red line -> Heart Rate, Blue line -> Pace, Green Line -> Ambient Temperature, Grey Area -> Elevation.
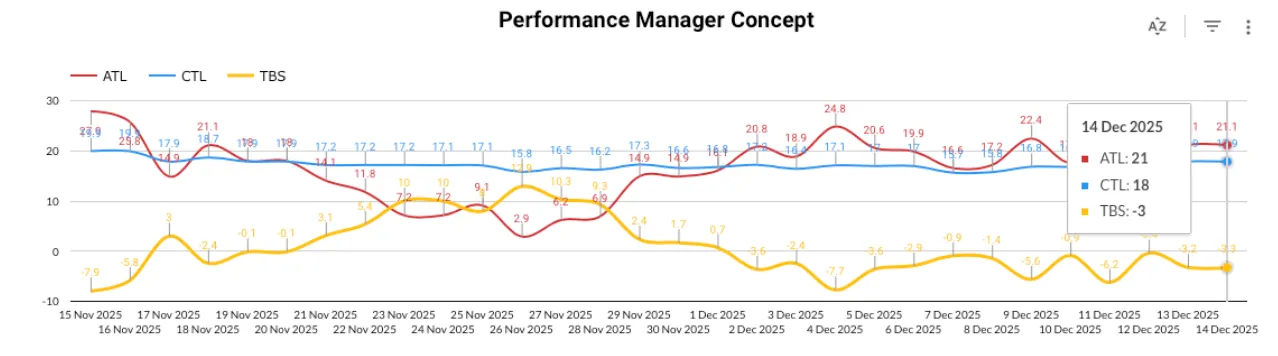
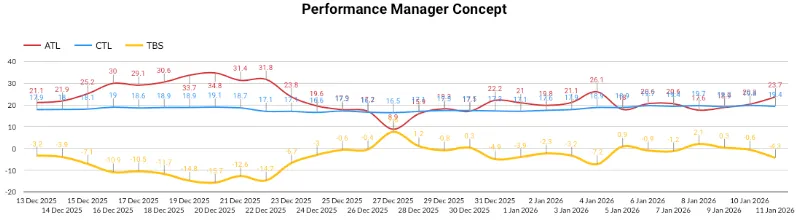
Week 6: Summary
ATL and CTL now within 10 units. With Winter arriving, it will be challenging to keep ATL at 25 for weeks 6-9, but that’s the goal.
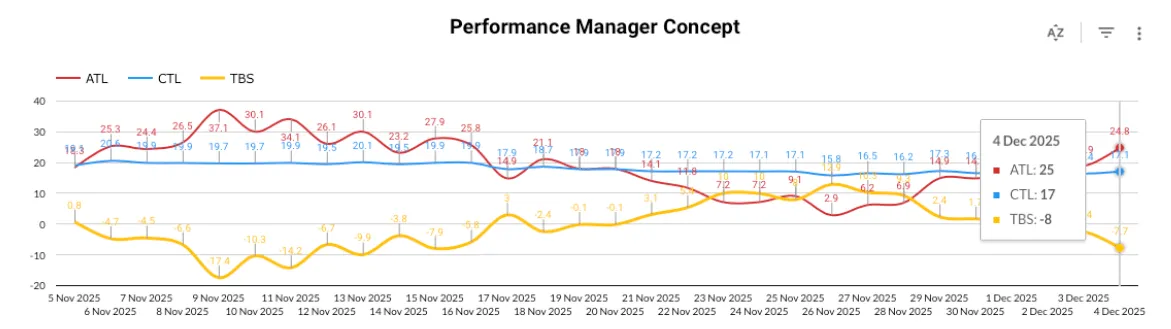
Here is the Performance Manager Chart at the end of week 6:
Week 7: Monday, December 8
Easy 3 km walk.
Week 7: Tuesday, December 9
Completed 2 x 2 km intervals at sub-LT2 (8.1 mph). Breathing was controlled and I am ready to increase to 3 x 2 km next session. Golfed in the afternoon as the weather was dry and warm (8 degrees Celsius).
TSS: 45.17, CTL: 17, ATL: 22
 Red line -> Heart Rate, Blue line -> Pace, Green Line -> Ambient Temperature, Grey Area -> Elevation.
Week 7: Wednesday, December 10
Resistance workout.
Week 7: Thursday, December 11
Completed 7 x 250 meter intervals over LT2 pace. Averaged about 14.5 kph. Legs felt great with lots of spring.
TSS: 42.02, CTL: 17, ATL: 24
 Red line -> Heart Rate, Blue line -> Pace, Green Line -> Ambient Temperature, Grey Area -> Elevation.
Week 7: Saturday, December 13
2 km outdoors to warm up and then 3.5 km on treadmill. Did 1.5 km effort (500m + 1 km) at race pace 14.2 kph or 8.8 mph. Heart band stopped sending signal part way through the run thus the no data mid-run.
TSS: 24, CTL: 17, ATL: 21
 Red line -> Heart Rate, Blue line -> Pace, Green Line -> Ambient Temperature, Grey Area -> Elevation.
Week 7: Sunday, December 14
Chronic training load value is increasing but the acute training load value is to remain 10 units more.
The initial plan for week 8 to add enough stress load keep CTL and ATL difference of 10 units:
- Monday: 3 x 2 km sub LT2 (around 8.1 mph pace), with proper warm up and cool down.
- Tuesday: 2 x 2 km sub LT2 (around 8.1 mph pace), with proper warm up and cool down.
- Wednesday: 30 minute active recovery w/ resistance training
- Thursday: 3 x 1 km at race pace (for sub 34 minute 8 km) with proper warm up and cool down.
- Friday: complete or active rest. Will decide day of.
- Saturday: 1 hour LT1 session.
- Sunday: 30 minute active rest.
Week 8: Monday, December 15
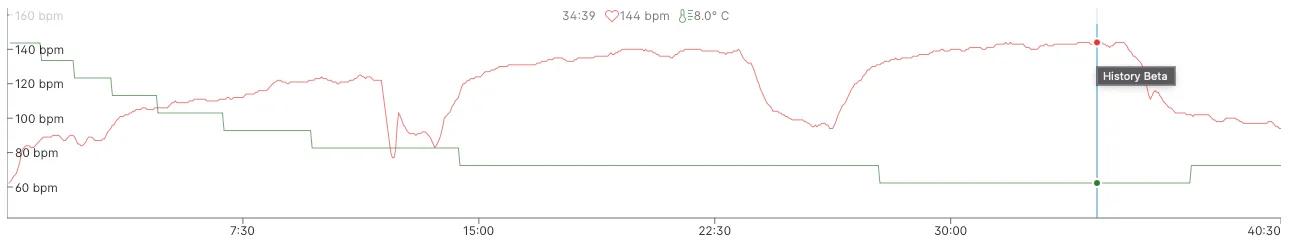
Ran on treadmill to control the interval pace. Completed the planned session, 3 x 2 km at 8.1 mph with warm up and down. Feels like the right amount of stress.
TSS: 56, CTL: 18, ATL: 25
 Red line -> Heart Rate, Blue line -> Pace, Green Line -> Ambient Temperature, Grey Area -> Elevation.
Week 8: Wednesday, December 17
Weather clear on Tuesday for a round of golf, so I switched training days and moved Tuesday workout to Wednesday. Ran on treadmill to control the interval pace. Completed the planned session, 2 x 2 km at 8.1 mph with warm up and down. Feels like the right amount of stress as the CTL and ATL are separated by 10 units.
TSS: 39.38, CTL: 19, ATL: 29
 Red line -> Heart Rate, Blue line -> Pace, Green Line -> Ambient Temperature, Grey Area -> Elevation.
Week 8: Friday, December 19
What started as a low intensity run turned into steady increase in pace and heart rate. Not sure of today’s running goal. Just enjoy the weather and the feel of running.
TSS: 64.09, CTL: 19, ATL: 34
 Red line -> Heart Rate, Blue line -> Pace, Green Line -> Ambient Temperature, Grey Area -> Elevation.
Week 8: Saturday, December 20
Enough load for the week, therefore, an easy 3.5 km walk.
TSS: 7.50, CTL: 19, ATL: 35
 Red line -> Heart Rate, Blue line -> Pace, Green Line -> Ambient Temperature, Grey Area -> Elevation.
Week 8: Sunday, December 21
Happy Winter Solstice. Good week of training with lots of sub-LT2. Feel a couple of days more to recover is needed. Therefore, the plan for week 9 is:
- Monday: 1 x 2 km sub LT2 (around 8.1 mph pace), with proper warm up and cool down.
- Tuesday: 3 x 2 km sub LT2 (around 8.1 mph pace), with proper warm up and cool down.
- Wednesday: 30 minute active recovery w/ resistance training
- Thursday: 5 km LT1.
- Friday: complete or active rest. Will decide day of.
- Saturday: 4 x 500m race pace: 8.8 mph with proper warm up and cool down.
- Sunday: 30 minute active rest.
Week 9: Monday, December 22
Easy 5.2 km run. Still fatigued from last week. Will decide training load day of.
TSS: 7.50, CTL: 19, ATL: 35
 Red line -> Heart Rate, Blue line -> Pace, Green Line -> Ambient Temperature, Grey Area -> Elevation.
Week 9: Wednesday, December 24
Decided more recovery was necessary. Indoor treadmill run of 3.6 km. Tomorrow I can accumulate more fatigue.
TSS: 8.00, CTL: 17, ATL: 20
 Red line -> Heart Rate, Blue line -> Pace, Green Line -> Ambient Temperature, Grey Area -> Elevation.
Week 9: Thursday, December 25
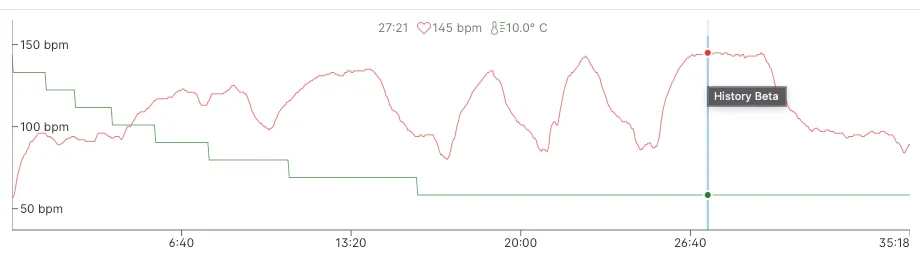
Did 1 x 2km effort in 8:35. Felt refreshed however, feel like I am losing condition.
TSS: 27.21, CTL: 17, ATL: 18
Week 9: Friday, December 26
2.5 km walk this morning. A little bit of resistance training. Traveling tomorrow, will be challenging to fit in a run.
TSS: 5.00, CTL: 17, ATL: 17
Week 9: Saturday, December 27
Spent the day driving. Managed to get a walk/jog in when walking the friend’s dog.
TSS: 6.00, CTL: 16, ATL: 9
Week 9: Sunday, December 28
2 x 2 km intervals at 8.1 mph followed by 4 x 1 min at 9.1 mph.
TSS: 56.75, CTL: 17, ATL: 16
 Red line -> Heart Rate, Blue line -> Pace, Green Line -> Ambient Temperature, Grey Area -> Elevation.
Week 10: Training Plan
- Monday: Recovery Run.
- Tuesday: Travel Day. Resistance workout in evening.
- Wednesday: 1 x 2 KM at 8.1 mph. 4 x 1 minute at 9.0 mph.
- Thursday: Travel Day. 35 minute recovery run. Resistance workout in evening.
- Friday: 6 x 1 minute at 9.0 mph.
- Saturday: Travel Day. 40 minute recovery run.
- Sunday: 3 x 2 km at 8.1 mph.
Week 10: Monday, December 29
Recovery run along Bunzten Lake. Stayed below LT1 the entire run.
TSS: 16.83, CTL: 17, ATL: 18
 Red line -> Heart Rate, Blue line -> Pace, Green Line -> Ambient Temperature, Grey Area -> Elevation.
Week 10: Wednesday, December 31
Tuesday was travel day. Today, training completed as planned.
TSS: 35.42, CTL: 17, ATL: 22
 Red line -> Heart Rate, Blue line -> Pace, Green Line -> Ambient Temperature, Grey Area -> Elevation.
Week 10: Friday, January 2
Too much driving to make Thursday’s training session. Today’s session was on a snowy path along Kootenay Lake in Nelson BC. It was just good to get a run in.
TSS: 18.83, CTL: 18, ATL: 20
 Red line -> Heart Rate, Blue line -> Pace, Green Line -> Ambient Temperature, Grey Area -> Elevation.
Week 10: Saturday, January 3
Warm up followed by 6 x 1 minute intervals at 9.0 mph. Overall, felt easy and heart stayed low. Thinking of adding some TSS tomorrow to prevent being too refreshed.
TSS: 14.62, CTL: 18, ATL: 21
 Red line -> Heart Rate, Blue line -> Pace, Green Line -> Ambient Temperature, Grey Area -> Elevation.
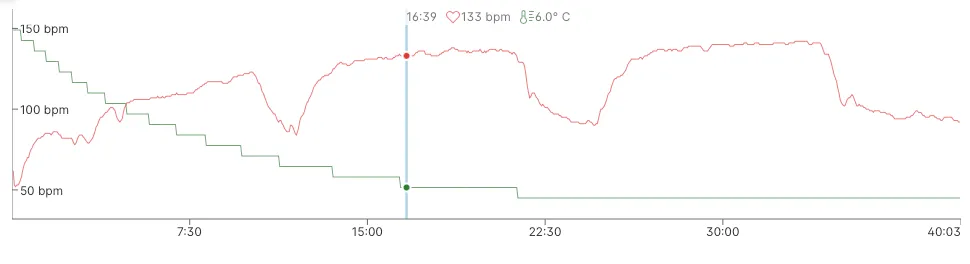
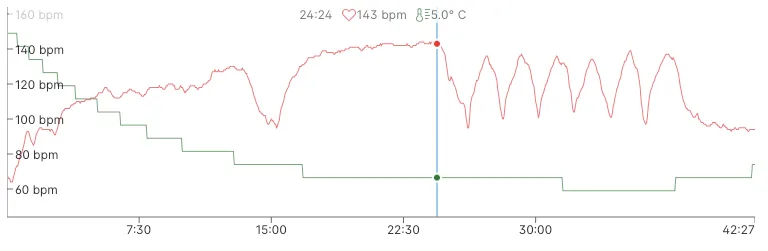
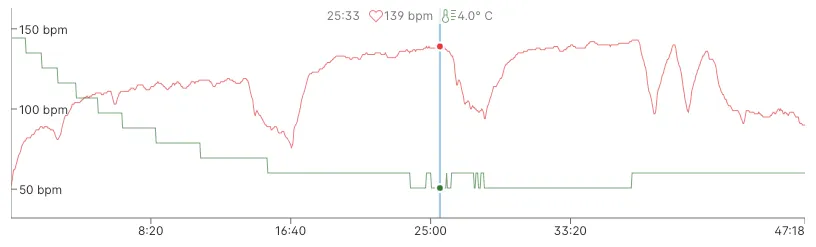
Week 10: Sunday, January 4
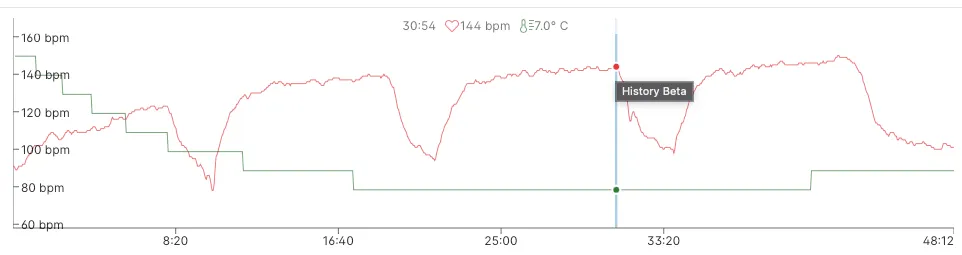
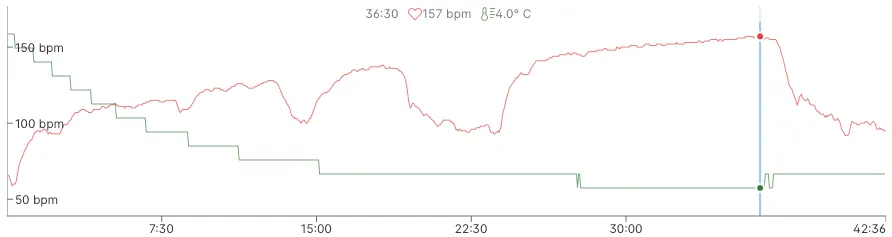
Decided a 2-mile effort was right for today. To make the most of training, I did a proper warm-up (3+ km). I then started the attempt at 13:20 on the timer and 8.8 mph. I chose this pace because I was sure I could finish 2 miles this way. If I felt good, I could increase the pace.
-
The start was good, and I settled into the pace quickly. Looking at the graph below, the attempt started around the 24:00 minute mark.
-
After about 3 minutes, I increased the pace to 8.9 mph. The pace felt comfortable. I wanted to be closer to the end before raising it again.
-
With 6 minutes remaining, I increased the pace to 9.0 mph and concentrated on running fluidly, ensuring balanced power from both legs.
-
With 4 minutes remaining, I increased the pace to 9.1 mph. The speed felt brisk yet manageable. Aware of the short time left, I was mentally prepared to push hard. My breathing stayed steady and deep.
-
The treadmill stopped with 3.18 km completed. I estimate another 10 seconds were needed to reach 3.20 km (or 2 miles). Therefore, I ran 2 miles in about 13:30, or about 90 seconds slower than the goal time. To even get under 13 minutes, I would have to average about 9.2 mph (14.87 km/h). It seems like a big ask with only 2 weeks of training remaining. When I do attempt the 2-mile again, I’ll try starting at 9.0 mph and hopefully be able to lift the pace from there.
Compared to my usual training pace, the outcome seems reasonable. Sub-LT2 training at 8.1 mph has been highly beneficial. I’ll incorporate more of it into next week’s training while avoiding excessive fatigue.
TSS: 40.68, CTL: 19, ATL: 26
 Red line -> Heart Rate, Blue line -> Pace, Green Line -> Ambient Temperature, Grey Area -> Elevation.
Week 11: Training Plan
- Monday: Active Rest
- Tuesday: 1 x 2 KM at 8.2 mph. 6 x 1 minute at 9.1 mph.
- Wednesday: 35 minute recovery run. Resistance workout in evening.
- Thursday: 6 x 1 minute at 9.1 mph.
- Friday: 40 minute recovery run.
- Saturday: Active Rest.
- Sunday: 4 x 2 km at 8.2 mph.
Week 11: Tuesday, January 6
Completed training session as planned. The only deviation was the pace was dropped to 8.1 mph in the last minute of the 2-mile interval.
TSS: 35.25, CTL: 20, ATL: 21
 Red line -> Heart Rate, Blue line -> Pace, Green Line -> Ambient Temperature, Grey Area -> Elevation.
Week 11: Thursday, January 8
Wednesday was complete rest. Completed today’s like Friday’s, which is a 40-minute recovery or sub LT1 effort. A slight bit of HR drift near the end (30 seconds above 121 BPM), otherwise stayed below the LT1 threshold the entire run. After a short warm-up, I jogged 5 km at a 5:20-minute-per-kilometre pace. That is approximately 7.0 mph. Wow, that is a massive improvement since I last tested, and I determined my LT1 threshold pace was 5.7 mph. Super pleased with this improvement, and it encourages me that the recent combination of LT1/LT2/speed work is having the desired aerobic effect.
TSS: 14.50, CTL: 20, ATL: 18
 Red line -> Heart Rate, Blue line -> Pace, Green Line -> Ambient Temperature, Grey Area -> Elevation.
Week 11: Friday, January 9
Did Thursday’s workout today. The 9.1 mph pace felt comfortable. Surprising how low the heart rate stayed. To warm up, I ran at 6.6 mph for over 1 km and heart rate stayed below LT1 threshold. To keep the intensity up, I’ll plan for about a TSS=30 tomorrow.
TSS: 8.67, CTL: 19, ATL: 19
 Red line -> Heart Rate, Blue line -> Pace, Green Line -> Ambient Temperature, Grey Area -> Elevation.
Week 11: Sunday, January 11
Rested Saturday. Today, worked LT1 and LT2 zones. Ran 2 km at 6.7 mph and stayed below LT1 threshold. Then ran 2 x 2 km at 8.1 mph and stayed below LT2 threshold. Finally, did 3 x 100m at 9.1 mph. Each effort felt comfortable.
TSS: 37.59, CTL: 19, ATL: 24
 Red line -> Heart Rate, Blue line -> Pace, Green Line -> Ambient Temperature, Grey Area -> Elevation.
Week 12: Training Plan
Continue taper for Sunday’s 8 km race. Keep the intensity and frequency, just lower the time.
- Monday: 25 minute recovery run. Stay below LT1 threshold.
- Tuesday: Warm-up with 1 x 2 km at 8.1 mph plus 4 x 1 minute at 9.1 mph.
- Wednesday: Resistance workout with core training.
- Thursday: Warm-up with 1 x 2 km at 8.1 mph plus 2 x 1 minute at 9.1 mph.
- Friday: Full rest.
- Saturday: Travel Day. Active Rest. Go for walk.
- Sunday: Race Day!!! Follow pre-race warm-up program.
Week 12: Monday, January 12
Nice weather so decided to go for a walk, just under an hour. Will do core exercises this evening.
TSS: 9.17, CTL: 20, ATL: 19
Week 12: Tuesday, January 13
Short and intense, ran for 25 minutes with 1 x 1 km at 8.1 plus 3 x 1 minute at 9.1 mph with 30 second rest.
TSS: 14.33, CTL: 20, ATL: 21
 Red line -> Heart Rate, Blue line -> Pace, Green Line -> Ambient Temperature, Grey Area -> Elevation.
Week 12: Thursday, January 15
Fartlek training. Did three hill intervals to open up the lungs.
TSS: 18.33, CTL: 18, ATL: 19
 Red line -> Heart Rate, Blue line -> Pace, Green Line -> Ambient Temperature, Grey Area -> Elevation.
Week 12: Friday, January 16
20 minute LT1 run at 6.7 mph.
TSS: 8.00, CTL: 19, ATL: 18
 Red line -> Heart Rate, Blue line -> Pace, Green Line -> Ambient Temperature, Grey Area -> Elevation.
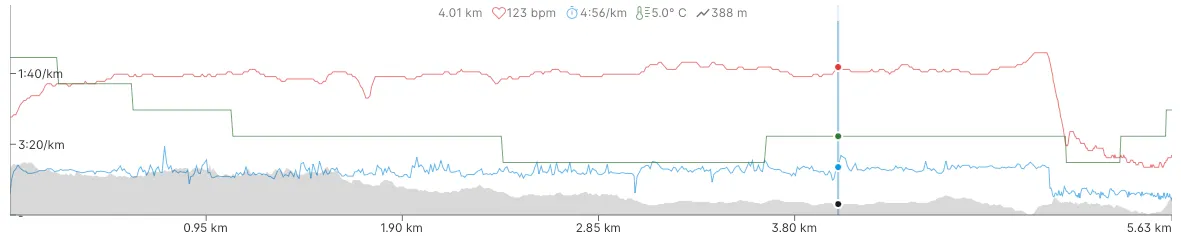
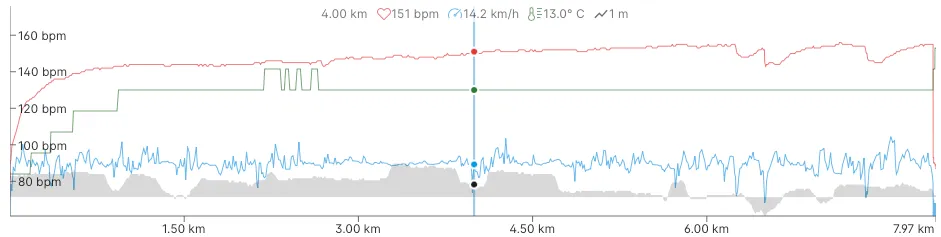
Week 12: Sunday, January 18
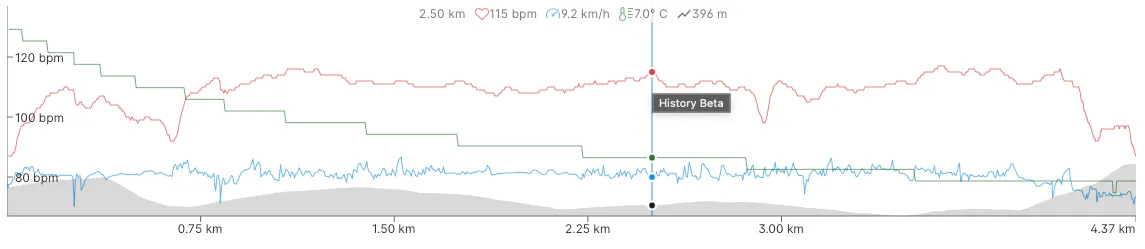
Warmed up at the hotel, ran 3.95 km on the treadmill. Also did glute activation.
 Red line -> Heart Rate, Blue line -> Pace, Green Line -> Ambient Temperature, Grey Area -> Elevation.
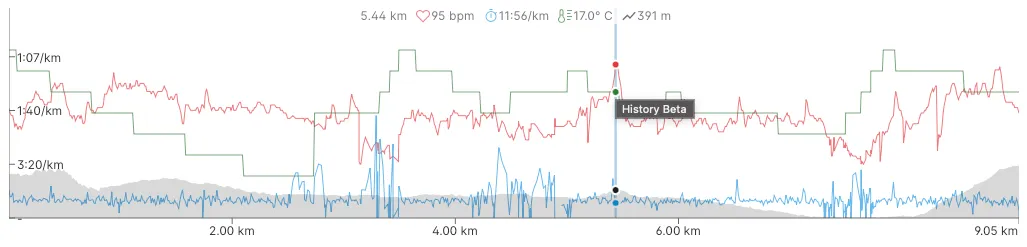
The race went well; I hit my 34:00 goal with an official time of 34:01 and placed 2nd in my age group. My legs felt springy, but I lacked sub-LT2 endurance. Once I train that zone, I’ll be able to sustain the pace start to finish.
Based on this race result and the pace of the 1st-place finisher, my next pace target is 3:55/km.
TSS: 76.90, CTL: 20, ATL: 28
 Red line -> Heart Rate, Blue line -> Pace, Green Line -> Ambient Temperature, Grey Area -> Elevation.
Conclusion
Even though this blog is titled sub 12, that target is not reasonable right now. I’ll keep training but for now won’t log my progress. As my pace improves and I get closer, I’ll update this blog then.